

アニメーションを描くプログラムをJupyterで実行するとうまく動かないので解決する方法を紹介する。
手っ取り早くJupyterで表示させたい方!
簡単にやりたいならセルの先頭に %matplotlib notebook を書けばOK
いつもなら %matplotlib inline と書いているところを %matplotlib notebook にする。
%matplotlib nbagg を使っているサイトも多かったけど、こっちの環境では動かなかった。
%matplotlib notebook
import numpy as np
import matplotlib.pyplot as plt
from matplotlib.animation import ArtistAnimation

fig = plt.figure()
# グラフの設定
plt.axes().set_aspect('equal')
plt.xlim(-1.5, 1.5)
plt.ylim(-1.5, 1.5)

# データの作成
frames = []
num_frames = 100
for i in range(num_frames):
    rad = 2*np.pi*i/num_frames
    x = np.cos(rad)
    y = np.sin(rad)
    frame = plt.scatter(x, y, color='blue')
    frames.append([frame])

# 描画b
ani = ArtistAnimation(fig, frames, interval=100)
# 表示
plt.show()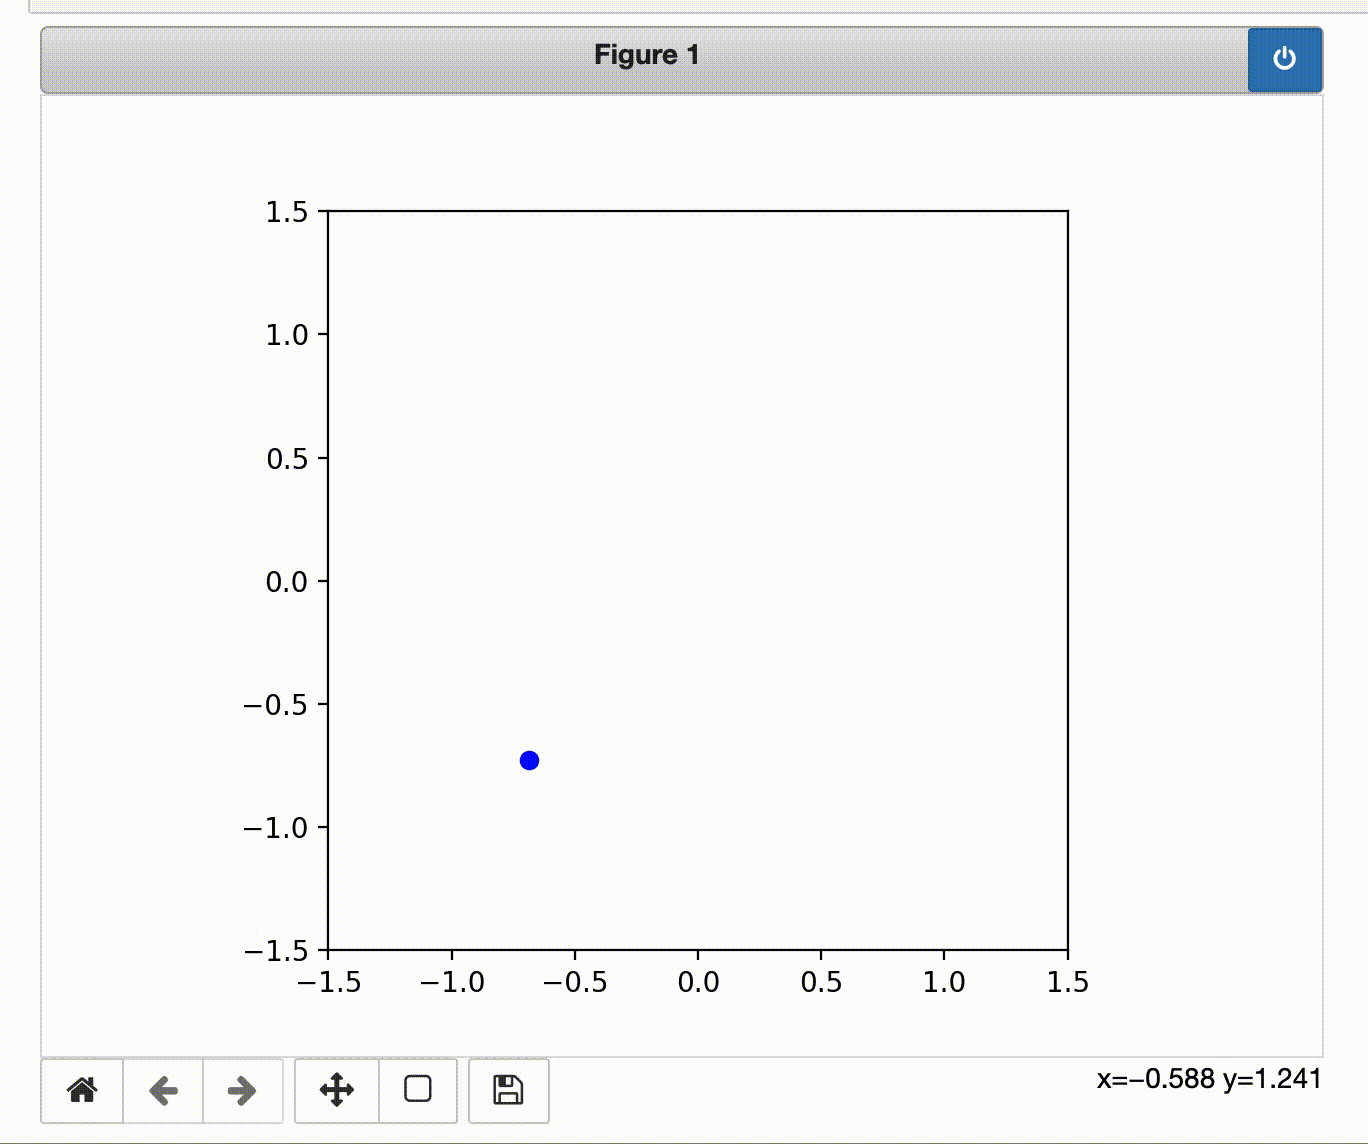
ちょっと高機能にJupyterで表示したい人
HTMLを使ってアニメーションを表示するとちょっと高機能にアニメーションを操作できる。
ちなみに アニメーションをmatplotlibで作成するためのクラスである ArtistAnimation と FuncAnimation には to_html5_video() と to_jshtml() という関数がありアニメーションをHTMLに変換してくれる。
どっちも同じ方法でJupyterに表示できるが表示結果が違ったので両方紹介しておく。
まずは to_jshtml()
以下の方法でやれば「一時停止」、「逆再生」、「早送り」などをGUIで行える。
import numpy as np
import matplotlib.pyplot as plt
from matplotlib.animation import ArtistAnimation
from IPython import display

fig = plt.figure()
# グラフの設定
plt.axes().set_aspect('equal')
plt.xlim(-1.5, 1.5)
plt.ylim(-1.5, 1.5)

# データの作成
frames = []
num_frames = 100
for i in range(num_frames):
    rad = 2*np.pi*i/num_frames
    x = np.cos(rad)
    y = np.sin(rad)
    frame = plt.scatter(x, y, color='blue')
    frames.append([frame])

# 描画
ani = ArtistAnimation(fig, frames, interval=100)
html = display.HTML(ani.to_jshtml())
display.display(html)
plt.close()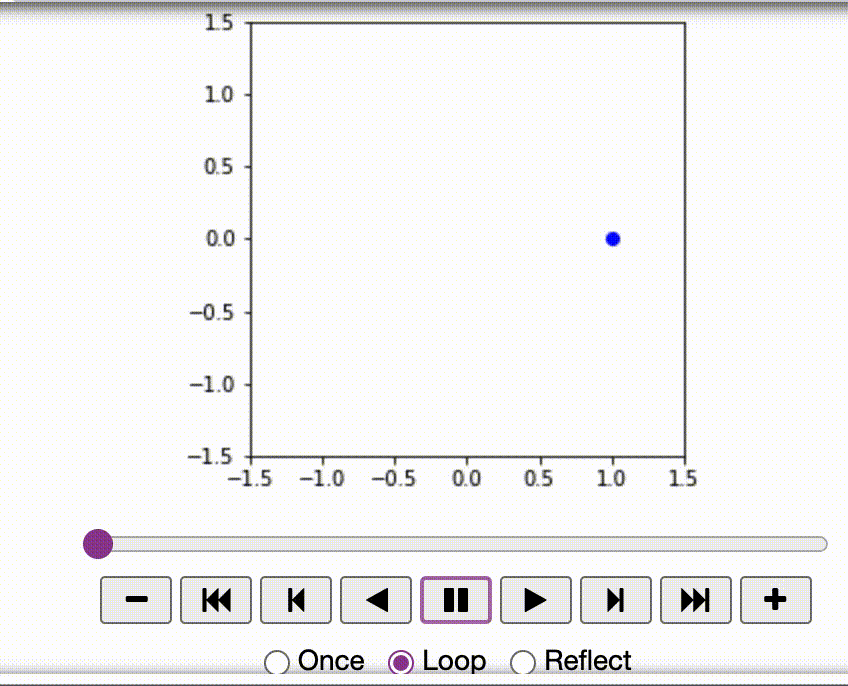
次に to_html5_video()
こっちの方法なら動画サイトみたいに「画面最大化」、「ピクチャーインピクチャー」、「再生速度」が使える。
import numpy as np
import matplotlib.pyplot as plt
from matplotlib.animation import ArtistAnimation
from IPython import display

fig = plt.figure()
# グラフの設定
plt.axes().set_aspect('equal')
plt.xlim(-1.5, 1.5)
plt.ylim(-1.5, 1.5)

# データの作成
frames = []
num_frames = 100
for i in range(num_frames):
    rad = 2*np.pi*i/num_frames
    x = np.cos(rad)
    y = np.sin(rad)
    frame = plt.scatter(x, y, color='blue')
    frames.append([frame])

# 描画
ani = ArtistAnimation(fig, frames, interval=100)
html = display.HTML(ani.to_html5_video())
display.display(html)
plt.close()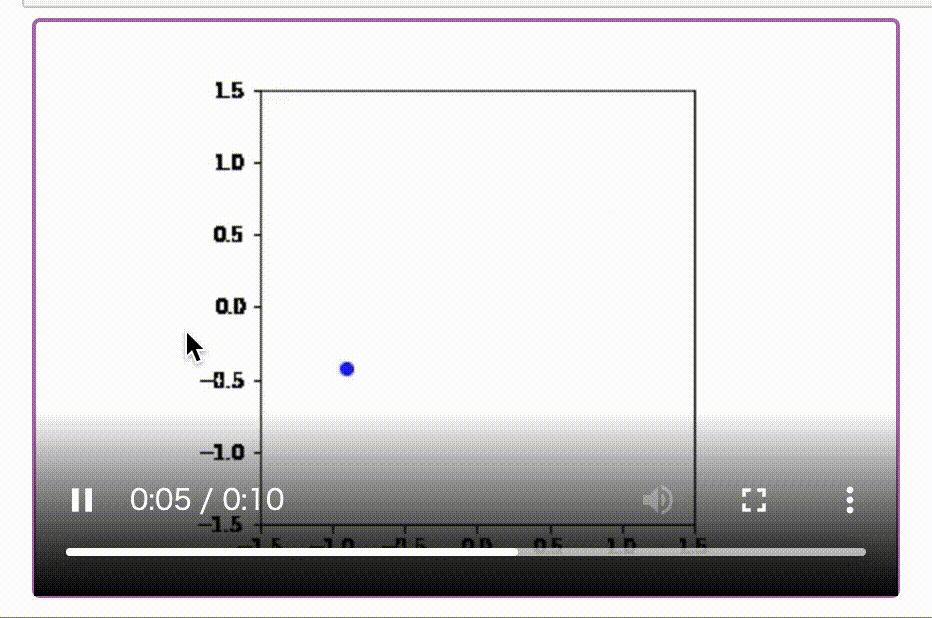
参考サイト

Matplotlib Animations in Jupyter Notebook
Creating animation graph with matplotlib FuncAnimation in Jupyter Notebook
towardsdatascience.com

コメント