

縦線・横線の引き方には2種類あります。
- hlines,vlines
- axhline,axvline
を使うやり方です。
axhline,axvlineではmin,maxがうまく機能しませんでした。
なぜかはこちらを参照ください
僕もいまいち理解していないので、後日記事を書くかもしれもせん。
Vertical line not respecting min,max limits (matplotlib)
Minimal working example of the issue: import matplotlib.pyplot as plt horiz_line = 0.0005 vert_line = 110 x_data = [10, 30, 50, 70, 90, 110, 130, 150, 170, 190,...
stackoverflow.com
水平線の書き方
matplotlib.pyplot.hlines
matplotlib.pyplot.hlines(y, xmin, xmax, color ='K', linestyles='solid', label='')- y : プロットするy軸の値
- xmin : 横線を始めるx軸の値
- xmax : 横線が終了するx軸の値
- color : 横線の色
- linestyles : 線の種類
- label : ラベル名
例
import matplotlib.pyplot as plt
import numpy as np

x = np.arange(-5, 5, 0.01)
y = np.sin(x)
plt.plot(x, y)

plt.hlines(0, -3, 3, color='g', linestyles='dotted')
plt.show()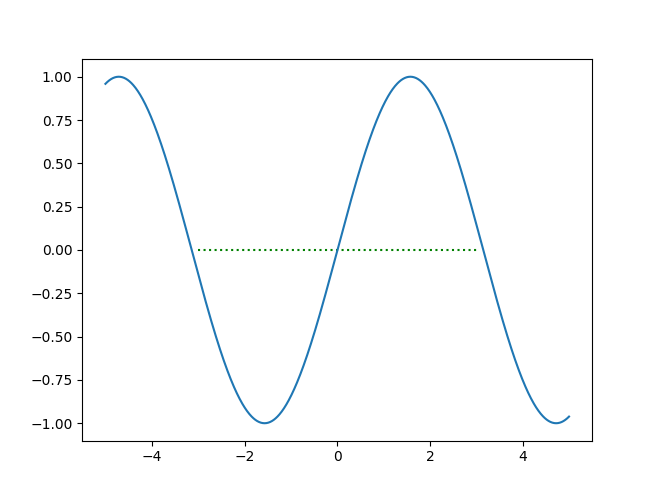
matplotlib.pyplot.axhline
matplotlib.pyplot.axhline(y=0, xmin=0, xmax=1)- y : プロットするy軸の値
- xmin : 横線を始めるx軸の値
- xmax : 横線が終了するx軸の値
例
x = np.arange(-5, 5, 0.01)
y = np.sin(x)
plt.plot(x, y)

plt.axhline(y=0.5)
plt.show()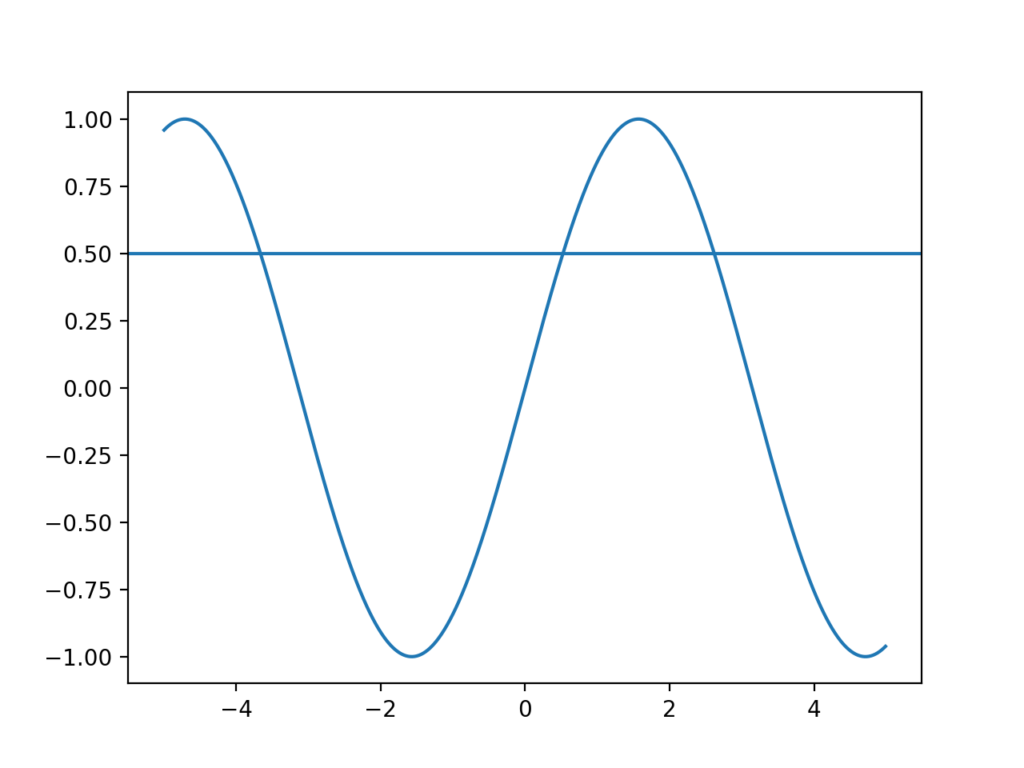
垂直線の書き方
matplotlib.pyplot.vlines
matplotlib.pyplot.vlines(x, ymin, ymax, colors='K', linestyles='solid', label='')- x : プロットするx軸の値
- ymin : 縦線を始めるy軸の値
- ymax : 縦線を終了するy軸の値
- colors : 縦線の色
- linestyles : 線の種類
- label : ラベル名
例
x = np.arange(-5, 5, 0.01)
y = np.sin(x)
plt.plot(x, y)

plt.vlines(2, -2, 1, color='g', linestyles='dotted')
plt.show()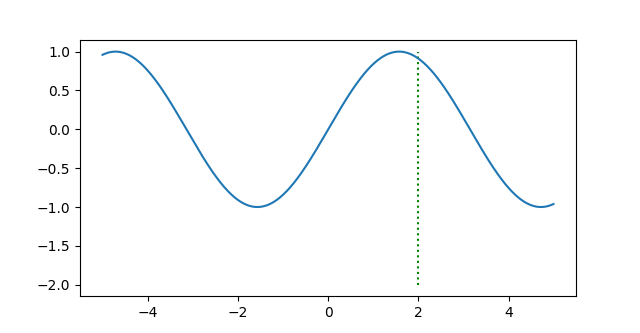
matplotlib.pyplot.axvline
matplotlib.pyplot.axvline(x=0, ymin=0, ymax=1)- x : プロットするx軸の値
- ymin : 縦線を始めるy軸の値
- ymax : 縦線を終了するy軸の値
例
x = np.arange(-5, 5, 0.01)
y = np.sin(x)
plt.plot(x, y)

plt.axvline(x=2)
plt.show()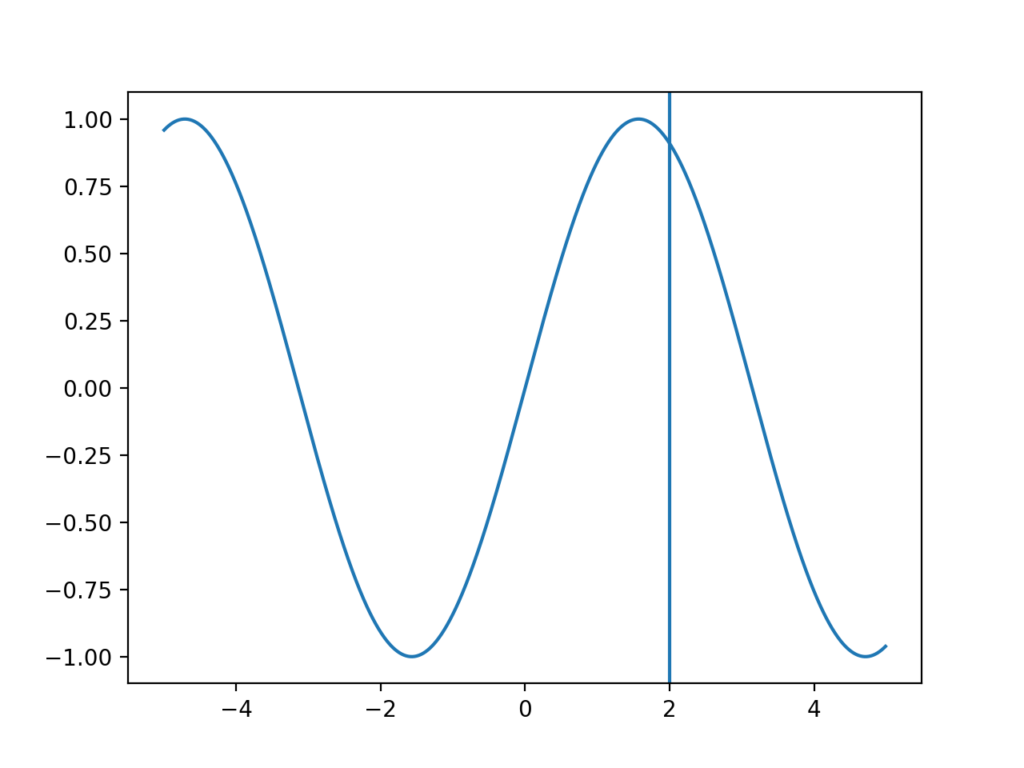


コメント